
|
Up or Down? (January 2019)
22/02/2019
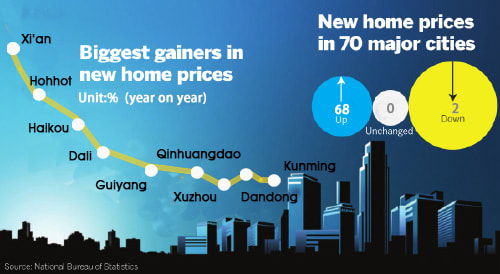
Image: BWPI
urbanisationnews
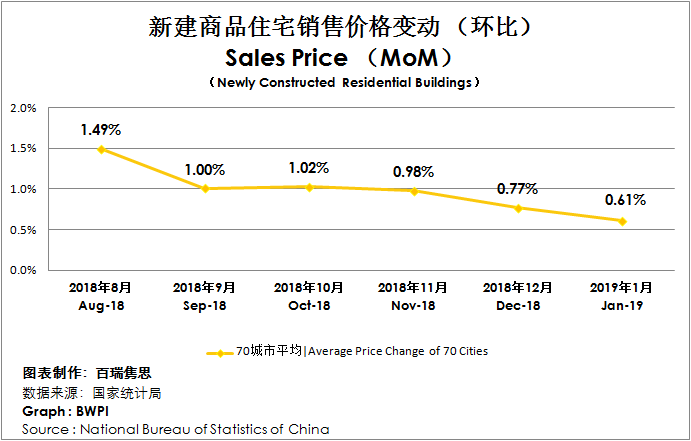
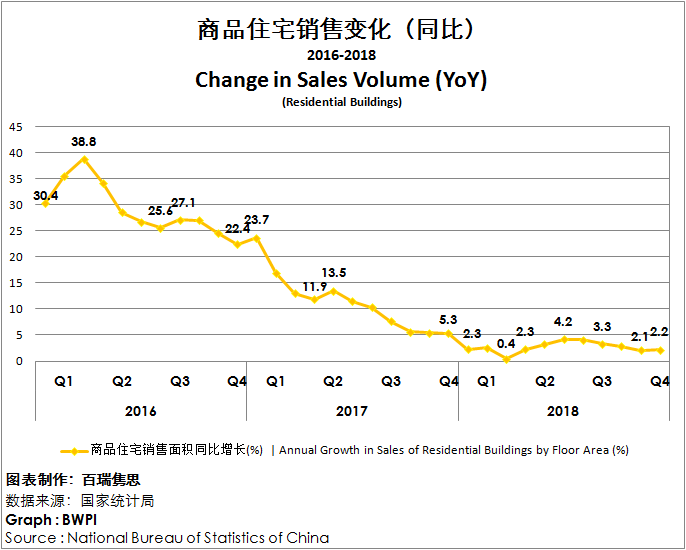
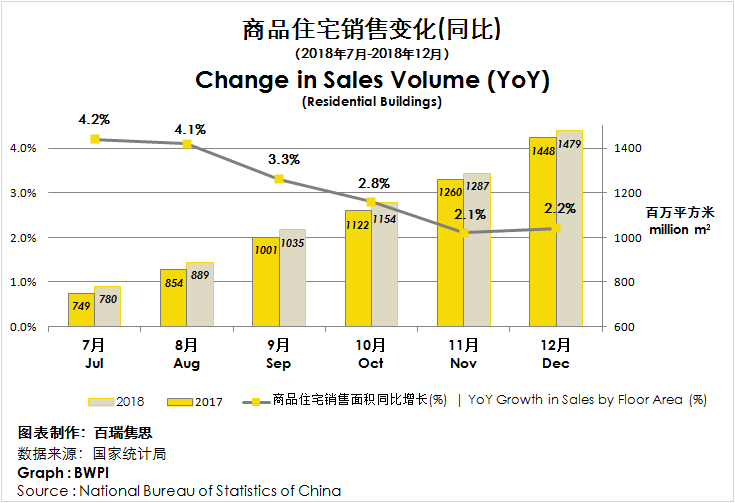
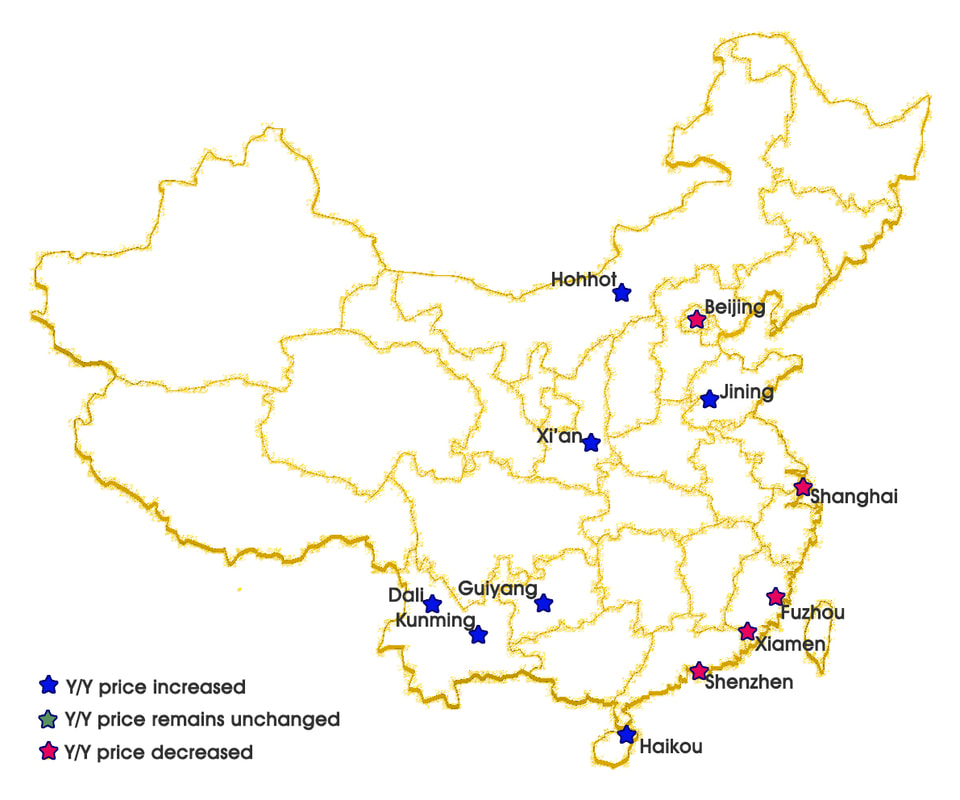
The house market continues its cooling trend in the new year, as we see the newly released data from the Statistic Bureau of China. Coupled with the declines in sales volume, weakening monthly price gains recorded in January. By contrast, the year on year price gains have accelerated to about 10 percent, according to our calculation. This may imply that there is still a strong underlying demand for housing.
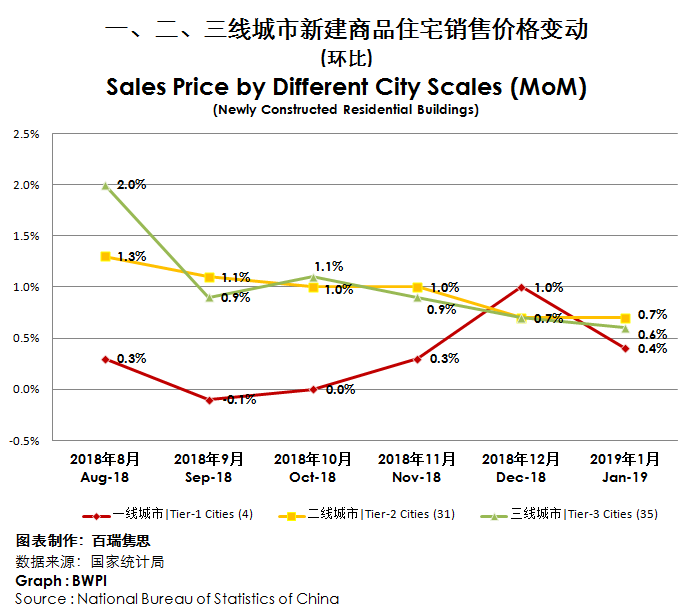
On an annually basis, the newly built home prices of the tier-1, tier-2 and tier-3 cities rose 3.3 percent, 11.6 percent and 11.0 percent in January, compared to the same period last year. Among the four tier-1 cities, Guangzhou reported the highest price rise (9.7 percent), followed by Beijing (2.8 percent) and Shanghai (0.9 percent). Shenzhen saw a 0.1 percent price loss in January. 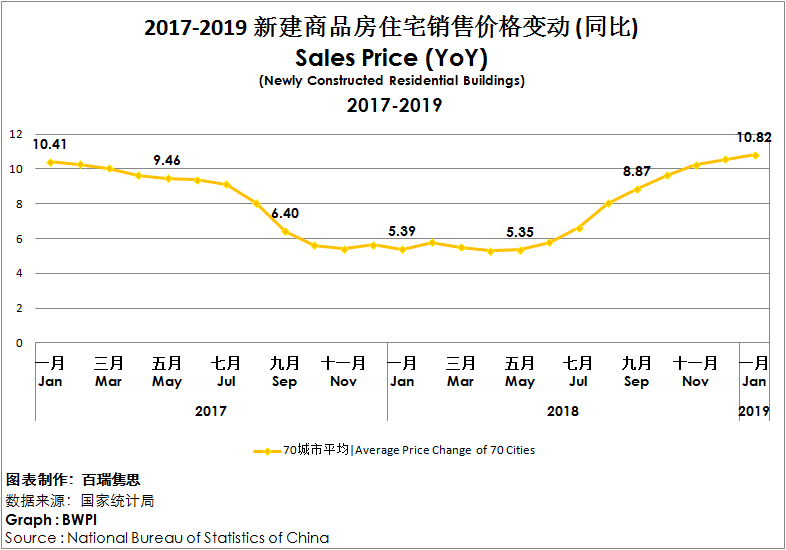
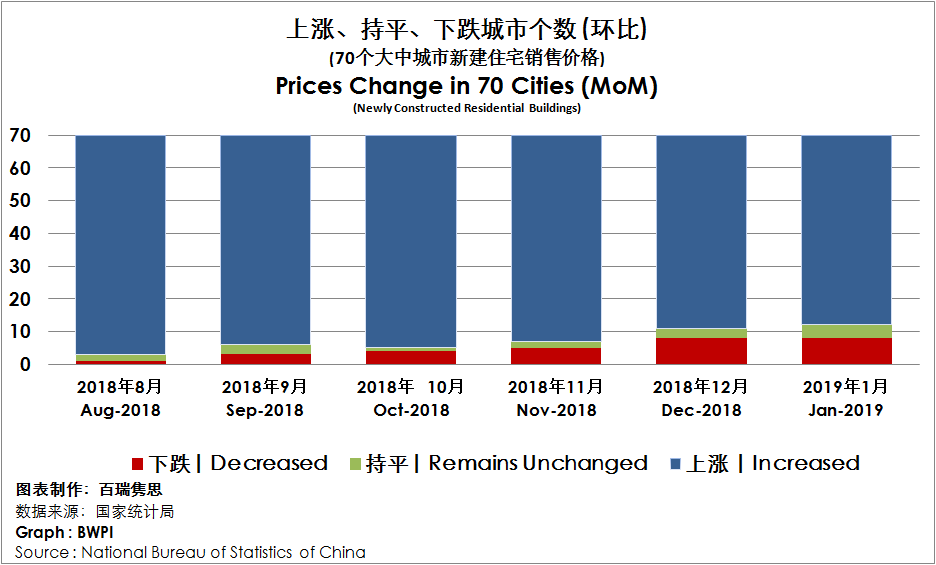
Fewer cities experienced a month on month increase in January, 58 of the 70 cities reported price gain, compared with 59 cities in a month earlier. Dali where the price increased 2 per cent is the biggest gainer among the price increasing cities. On the other hand, 8 cities reported price decrease, and the prices in 4 cities remain unchanged.
Read the original article at stats.gov
2018/11/28
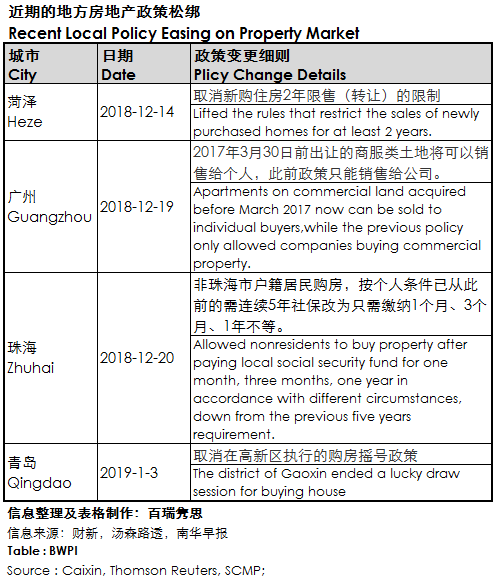
Up or Down? (October 2018) 2018/8/31 Up or Down? (July 2018) 2017/05/31 Up or Down? (April 2018) 2017/11/23 Up or Down? (October 2017) 2017/10/27 Up or Down? (September 2017) 2017/09/26 Cities Innovate with Housing Changes |

Wechat

|

Services |