
|
Up or Down? (October 2018)
28/11/2018
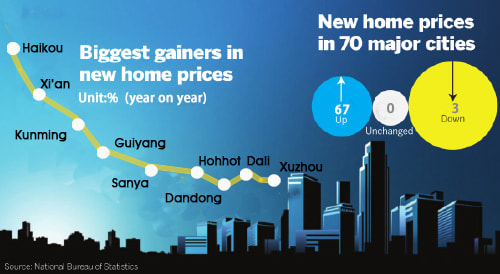
Image: BWPI
urbanisationnews
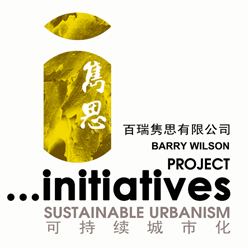
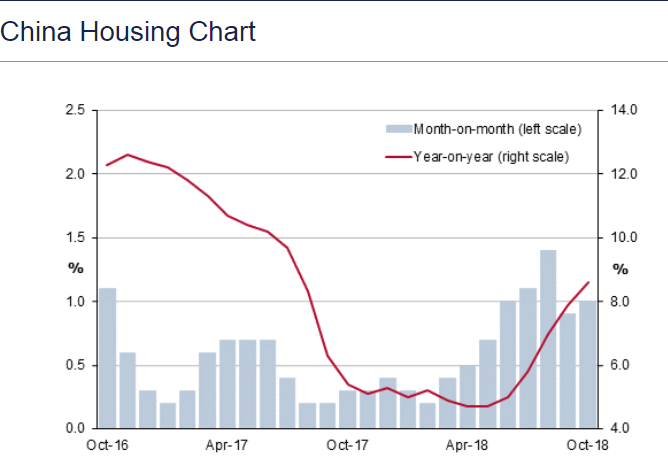
Sales Prices of Residential Buildings in 70 Medium and Large-sized Cities in October 2018China's new home prices saw an 8.6 percent year on year increase in October, accelerating from a 7.9percent rise in September, despite government measures to rein in prices. It is the 42nd straight month of price increases and the steepest rate in over one year. Sixty seven out of the 70 cities surveyed by the NBS reported the annually price increase. The biggest gain was seen in the city of Haikou, in Hainan province, where prices jumped 22.4 per cent over last 12 months. This round of price increase was concentrated in the tier 2 and tier 3 cities, as the new home prices in tier 2 and tier 3 cities rose 10.4 percent and 10 percent year on year respectively. Among the 4 largest cities, the biggest price gain was observed in Guangzhou (4.7 percent), followed by Beijing (0.8 percent), whereas Shenzhen and Shanghai recorded price declines (-0.4 percent each). The data on month on month changes shows a similar picture. The new home prices in 4 major cities were almost unchanged, while prices in tier 2 and tier 3 cities increased 1 percent and 1.1percent. The biggest gainer in October is Guiyang, which the prices went up 4.2 percent, compared with 2.1 percent and 1.8 percent in two previous months. Nevertheless, the city of Xi'an saw the largest increase over the last quarter as the price growth suddenly jumped to 3 percent and 6.2 percent in August and September. It is worth noting that the prices in the secondary market continued to cool in October that 14 cities recorded price drops and the average price gain across all cities slowed to 0.3 percent last month from 0.8 percent in September. Therefore, we can see that the overall buying sentiment has been cooling over the past two to three months.
2018/8/31
Up or Down? (July 2018) 2017/05/31 Up or Down? (April 2018) 2017/11/23 Up or Down? (October 2017) 2017/10/27 Up or Down? (September 2017) 2017/09/26 Cities Innovate with Housing Changes |

Wechat
|

Services |