
|
Up or Down? (April 2018)
31/05/2018
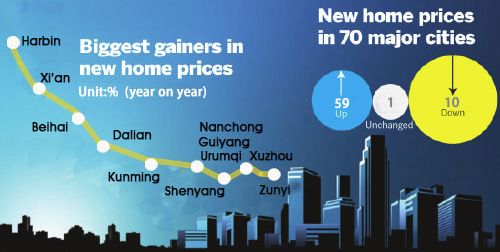
Image: BWPI
chinaurbanisationnews
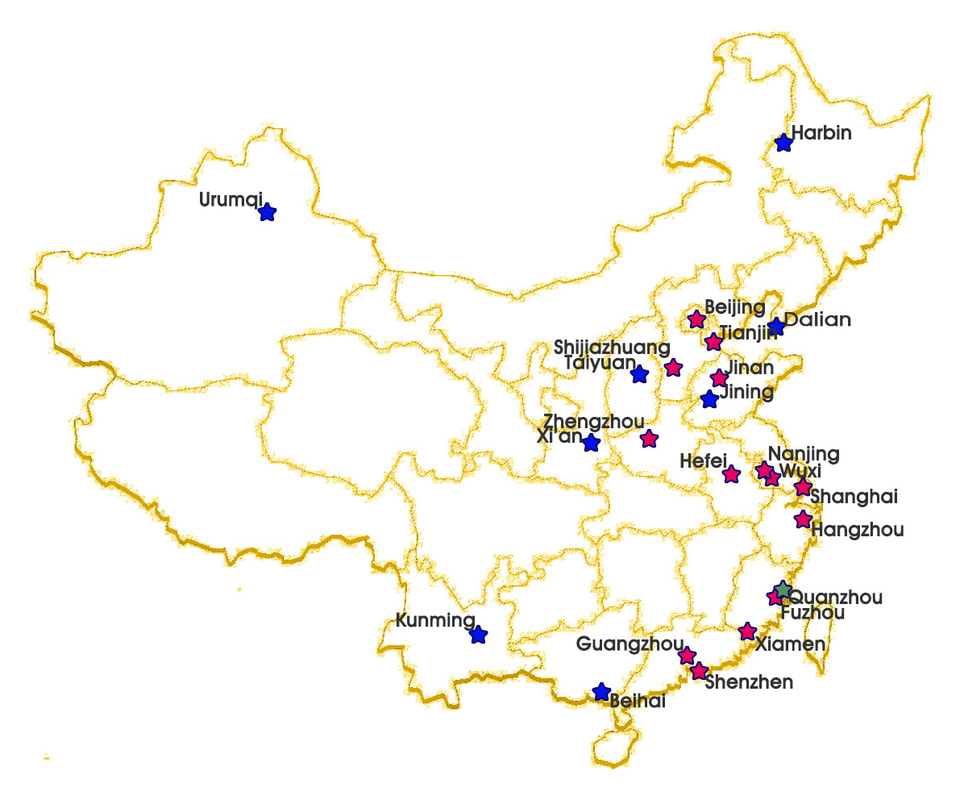
Sales Prices of Residential Buildings in 70 Medium and Large-sized Cities in April 2018
The house prices in 70 major Chinese cities have experienced fewer fluctuations over the past year. Prices of first-hand and second-hand homes in smaller cities, known as tier-2 or tier-3 had the price gains, rather than 1st tier cities. New house prices in Beijing, Shanghai, Guangzhou and Shenzhen saw minor drops, compared to the same month last year.
Read the original article at stats.gov
2017/11/23
Up or Down? (October 2017) 2017/10/27 Up or Down? (September 2017) 2017/09/26 Cities Innovate with Housing Changes 2017/09/05 Up or Down? (July 2017) |

|

Services |